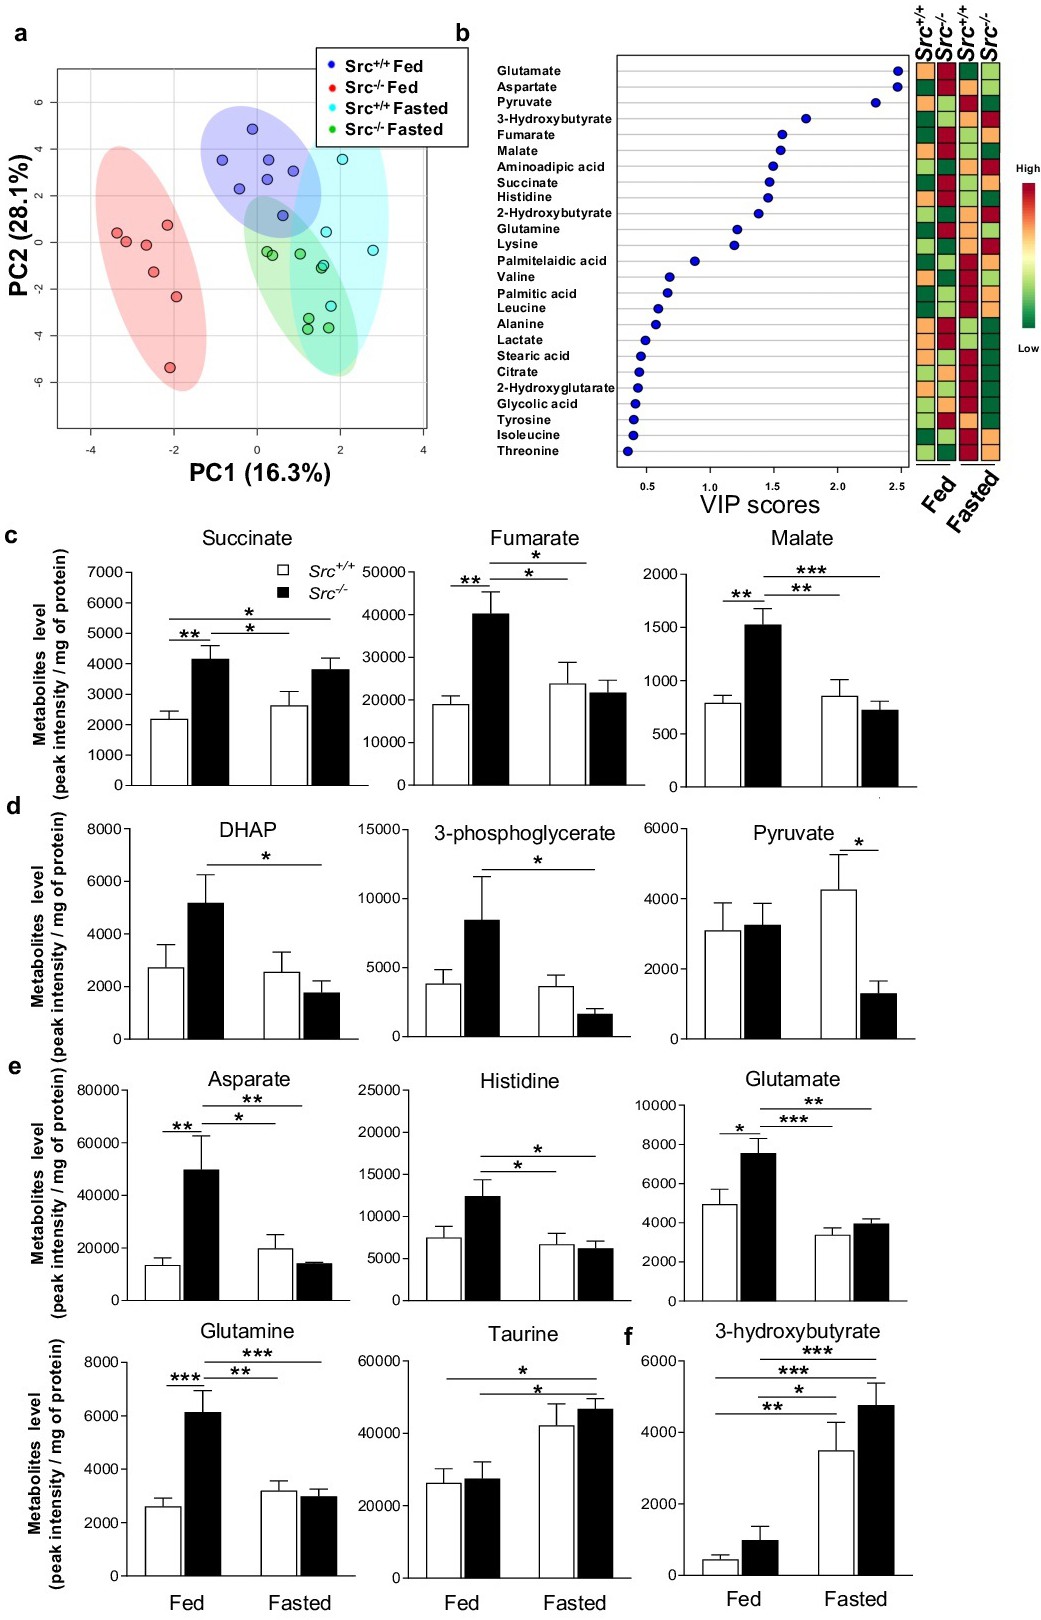
Fig. 3. Modulation of metabolomics by Src according to nutrient availability. (a) PLS-DA score plots of metabolites in fed or fasted Src+/+ and Src-/- mice. Ellipses represent 95 % confidence intervals for each individual group on PLS-DA plots with the variance proportion represented by principal components 1 and 2 (PC1 & PC2, respectively). (b) Variable importance of projection (VIP) scores of PLS-DA, which identify the key metabolites driving the metabolomic signature for fed and fasted Src+/+ and Src-/- mice. (c-f) Quantitative analysis of intermediates of TCA cycle (c) and glycolysis/neoglucogenesis (d), amino acids (e) and ketone bodies (f) identified as drivers of the metabolomic signature of Src+/+ and Src-/- mice fed ad libitum or fasted. See also Fig. S2 for metabolites not significantly different among experimental groups. Data are presented as mean ± s.e.m. (n = 7). *p<0.05, ** p<0.01, ***p<0.001 determined by a two-way ANOVA followed by post-hoc Tukey's test.